
The Dashboard That Started It All.
Data Storytelling.

Every data storyteller has a starting point, and for me, it all began with a simple Tableau dashboard. I was exploring an education dataset that showed different fields of study, how many students were in each, and their average starting salaries. It wasn’t a huge project but it changed how I see data.
When I started building the dashboard, I didn’t have a complex goal. I just wanted to visualize something meaningful. I created two charts: one showing how many students were in each field of study, and another showing the average starting salary for those fields.
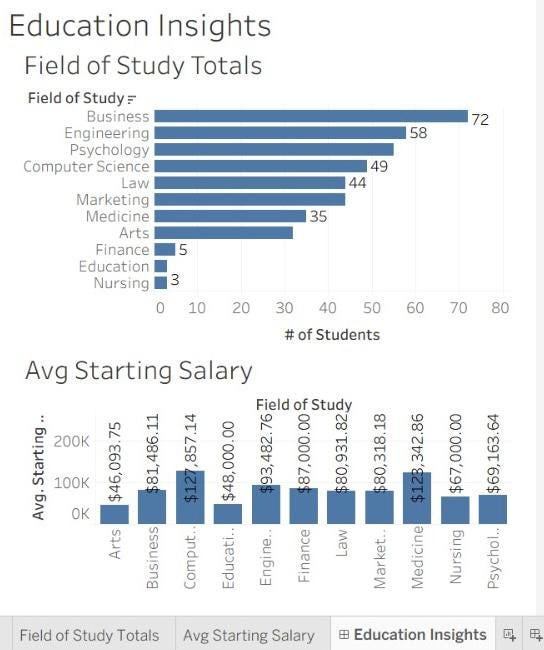
Right away, the patterns started to tell a story. Business, Engineering, and Psychology stood out as the most popular choices among students. Meanwhile, fields like Finance, Education, and Nursing had fewer students. Then came the twist when I looked at the salary chart, Medicine and Finance was the top of the list, while Arts and Education were on the lower end.
It made me pause. The fields most people chose weren’t necessarily the ones with the highest pay. That’s when you realize that data can reveal more than just facts, it can challenge assumptions.
This was my first real experience with Tableau, and I quickly learned that data visualization isn’t just about making graphs look good. Every design choice matters, the colors, the order, even the labels. Each detail shapes how people interpret the story.
But more than the technical part, what I really discovered was the curiosity behind the analysis. I found myself asking why certain patterns appeared, what they meant, and what might be influencing them. That curiosity made the data feel alive.
That simple dashboard marked the beginning of something bigger for me. It showed me that data storytelling is about connection between people and insights, between numbers and their meaning.
I know it’s just the first of many dashboards I’ll create, but it’s special because it started everything. It reminds us that every dataset has a story, and it’s up to us to uncover it and share it in a way that others can understand.
So yes, it is just a small dashboard but it is also the moment you realize how powerful data storytelling can be.
Thanks for reading. Cheers, everyone!